
Process balance · treatment-to-filler sizing
Match Treated-Water Output to the Filling and Cleaning Demand
A filler rating in bottles per hour does not directly state the required treatment-system feed or permeate flow. Bottle volume, treatment recovery, product storage, rinsing, cleaning and operating schedules all affect the balance.
DIRECT ANSWER
What the buyer should decide
Start with bottles per hour multiplied by fill volume. Then separate instantaneous bottle-water demand, daily product volume and treatment production hours. Add losses and other water uses separately; average daily treatment output is not proof that the filler can be supplied at every moment.
| Decision field | Confirm | Why it changes the purchase |
|---|---|---|
| Product demand | Bottle volume multiplied by effective saleable output | Defines the core treated-water load |
| Process demand | Rinsing, sanitation, CIP and startup consumption | Adds non-saleable water demand |
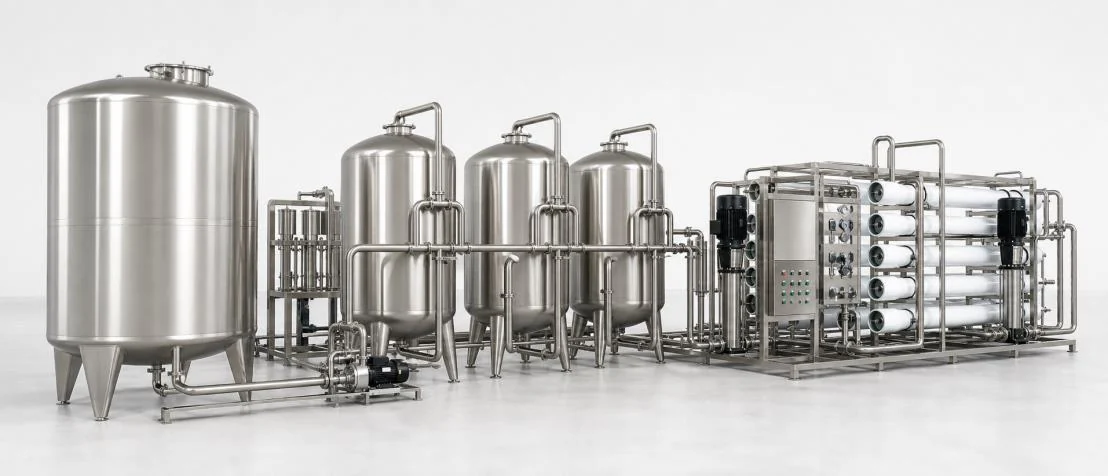
| Treatment supply | Feed flow, recovery, permeate storage and operating hours | Defines raw-water and storage balance |
BUYER DECISION WORKBENCH
Calculate bottle-water demand before comparing treatment offers
Enter your own operating basis. The optional recovery input only converts net product flow into an illustrative RO feed/concentrate balance; it does not choose or validate the recovery of a real membrane system.
Worked example, not an Allot Tech equipment rating: 5,000 bottles/hour x 0.5 L = 2,500 L/hour inside bottles. Eight bottling hours use 20,000 L/day. Over ten net treatment hours, the daily-average product requirement is 2,000 L/hour. At an illustrative 75% RO recovery, the corresponding feed is 2,666.67 L/hour and concentrate is 666.67 L/hour, excluding other water demands.
BUYER DECISION WORKBENCH
Keep water demand, delivery and storage separate
Storage may bridge a timing difference, but a daily total alone cannot establish usable tank volume, acceptable residence time or hygiene design. Review the actual demand and production timeline.
| Quantity | How to define it | Do not confuse it with |
|---|---|---|
| Bottle-water demand while filling | Entered bottle rate x actual fill volume, plus separately assessed fill losses | Total raw-water intake or a membrane feed rating. |
| Daily product requirement | Water inside bottles over the chosen operating hours | A guarantee that supply is available during every production peak. |
| Net treatment delivery | Usable product output after the treatment system's internal uses and unavailable time | A filtration-only or membrane nameplate flow. |
| Additional site-water uses | List bottle rinse, CIP/cleaning, backwash and other uses at their actual supply points | An automatic percentage added to every flow, which can double-count demand. |
| Usable storage and pumping | Agreed operating-level range, schedule, withdrawal rate and hygiene constraints | The gross geometric tank volume or a substitute for adequate long-term production. |
- Locate each extra use before or after the membrane stage before applying recovery.
- Avoid double-counting backwash when a supplier already quotes net delivered output.
- Agree the filler inlet delivery duty and any buffer arrangement, not just liters per day.
REQUIRED INPUTS
Prepare the evidence before selection
Missing fields should remain marked as open rather than converted into assumptions.
- Bottle volumes and output by SKU
- Filler production schedule
- Rinse and sanitation demand
- Treatment recovery assumptions
- Raw-water quality and availability
- Treated-water storage strategy
- Cleaning and peak-demand schedule
TRADE-OFFS
Make the choice visible
Every option changes the machinery, operating work or project boundary.
Larger treatment train
Provides more instantaneous flow while increasing capital and utility demand.
More treated-water storage
Separates treatment and filler schedules while adding sanitation and residence-time control.
Longer treatment hours
Can reduce instantaneous capacity when the water source and operating plan support it.
PURCHASING RISKS
Do not let these gaps hide in the quotation
Carry every unresolved item into clarification and contract documents.
- Sizing treatment from filler BPH alone
- Applying one recovery number without water data
- Ignoring rinse and CIP demand
- Using storage as a substitute for sanitation planning
WORK SEQUENCE
Move from data to a controlled next action
- 01
Calculate product liters.
- 02
Add non-product demands.
- 03
Set treatment recovery and hours.
- 04
Balance tanks and peak periods.
- 05
Confirm water-quality and sanitation boundaries.
BUYER QUESTIONS
Answers to common bottled-water machinery searches
Use these answers to prepare the next supplier question; final configuration remains project-specific.
How much water does a 5,000 BPH line use?
At an illustrative 0.5 L fill, water inside bottles is 2,500 L/hour while filling. That excludes rejected product, rinsing, cleaning, treatment losses and other uses. Use the real bottle size and operating schedule before sizing supply equipment.
Can treatment output be lower than the instantaneous filling demand?
Only a properly assessed production schedule and usable storage arrangement could bridge a timing difference. Matching daily totals alone does not prove the filler can be supplied, and the calculator does not size or approve a tank.
What does the optional RO recovery input calculate?
For the entered daily-average product requirement, feed equals product divided by recovery as a fraction; concentrate is feed minus product. The chosen recovery must be supported by the actual treatment design and operating conditions.
Representative machinery views
Compare the machinery form before selecting the project scope

Technical descriptions are selection guidance. Final machine, capacity, material, component, interface, utility and service details must be confirmed in the project proposal.
Content reviewed:
NEXT PURCHASING ACTION
Put the treatment and filler on one time basis.
Send bottle volumes, output, water analysis and operating hours for a preliminary balance.